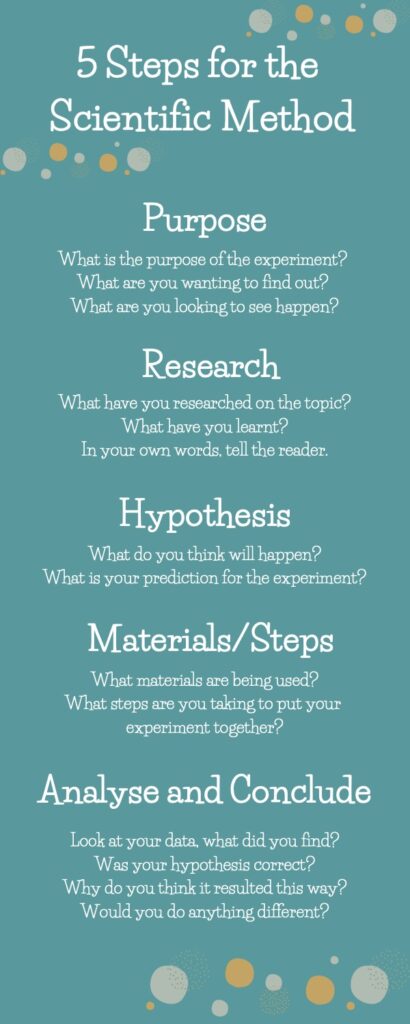
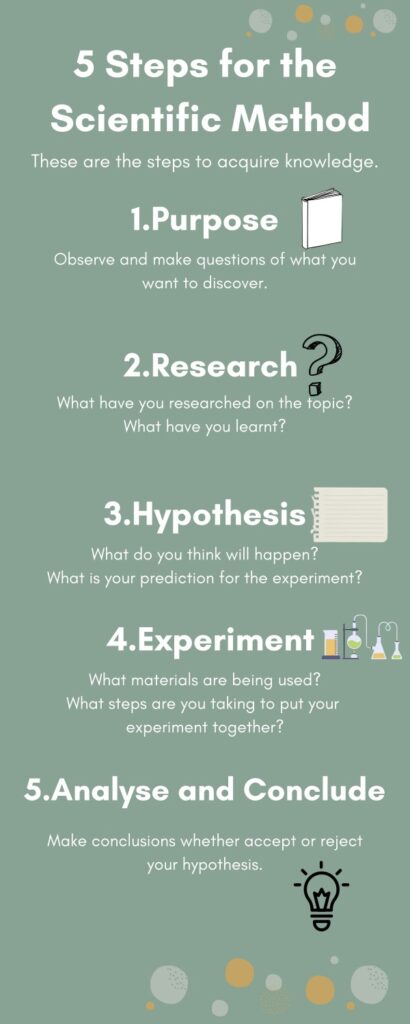
In the core multimedia assignment, I choose to use Canva to update and improve the previously prepared infographic. To better fulfil its goal of boosting knowledge transfer, the new infographic refreshes both the design and the content, as well as following more multimedia concepts,
What is an infographic?
According to Wikipedia, infographics are graphic visual representations of information, facts, or knowledge designed to deliver information quickly and clearly (Wikipedia, 2022). Infographics, unlike PowerPoint, focus on utilising minimal language to provide an easy-to-understand overview of a topic.
What do I change?
In comparison to the previous version, I revised the design, content, and organisation of the new infographic. With a better-organized infographic, viewers will be able to follow along with the ideas provided and achieve the infographic’s goal, which is to demonstrate how to apply the scientific method. The usage of visuals can also help to improve the learner’s memorization and perception of the main subject by promoting their knowledge of the various subtopics.
Multimedia Theories
The new infographic is more successful at enhancing knowledge transfer since it adheres to more fundamental multimedia concepts. I started by using the Pre-Training Principle. I included a title description to provide students with a rudimentary concept of the scientific approach. In addition, I altered the backdrop colour to a lighter green, making the infographic more basic and approachable. In comparison to the original, the new infographic made use of small, linked pictures and symbols. The signalling concept (Mayer, 2009) supports this, as linked images highlight the material’s contents. Readers will be able to focus their attention better as a result of this.
Leave a Reply
You must be logged in to post a comment.